The following is a report on the data gathered from April to June 2021 by the EDSA Guadalupe LED board and the C5 Salonga LED board — Outcomm’s best digital out-of-home advertising LED video boards in EDSA and C5.
APRIL 2021
Weekly Data Summary for the EDSA Guadalupe LED board: April 2021
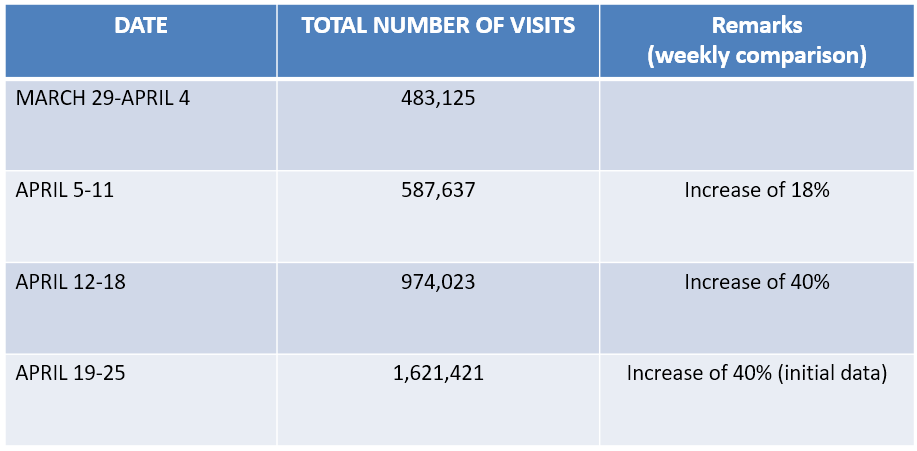
The table above shows the total number of visitors that the EDSA Guadalupe LED board had received for every week of April 2021.
From March 29 to April 4, a total of 483,125 visitors were recorded to have passed by the EDSA Guadalupe LED board site. The number of visitors increased by 18% from April 5 to 11 with 587,637 visitors.
The number of visitors on EDSA Guadalupe LED further increased by 40% from April 12 to 18 with 974,023 visitors and another 40% from April 19 to 25 with 1,621,421 visitors.
Data Overview for the EDSA Guadalupe LED board: April 12 to 18

The graph above shows the daily overview of the potential views, reach, and frequency of visits recorded at the EDSA Guadalupe LED board site from April 12 to 18.
There was an increase of 40% visitors compared to the previous week with the number being significantly higher during the weekends.
The number of gadget enthusiasts profiles have also increased. Other top visitor profiles include commuters, food lovers, grocery shoppers, and mid-income earners.
One of the factors that affected the large increase in the number of visitors is the lifting of the Enhanced Community Quarantine (ECQ) in Metro Manila. Thus, more commuters are now going out and passing by the EDsA Guadalupe LED board site.
Data Overview for the EDSA Guadalupe LED board: April 19 to 25

The graph above shows the daily overview of the potential views, reach, and frequency of visits recorded at the EDSA Guadalupe LED board site from April 19 to 25.
The number of visitors on a daily basis during this week is about the same. Since the lifting of the ECQ, the number, of visitors continued to increase and commuters are still dominating as the top profile. The majority are likely traveling out for basic necessities.
Weekly Data Summary for the C5 Salonga LED board: April 2021

The table above shows the total number of visitors that the C5 Salonga LED board had received for every week of April 2021.
From March 29 to April 4, a total of 291,795 visitors were recorded to have passed by the C5 Salonga LED board site. The number of visitors increased by 21% from April 5 to 11 with 367,780 visitors.
The number of visitors on C5 Salonga LED further increased by 30% from April 12 to 18 with 527,546 visitors and another 50% from April 19 to 25 with 1,065,035 visitors.
Data Overview for the C5 Salonga LED board: April 12 to 18

The graph above shows the daily overview of the potential views, reach, and frequency of visits recorded at the C5 Salonga LED board site from April 19 to 25.
The number of visitors this week were increasing towards the end of the week — the week after the extended ECQ.
The majority of visitors are most likely heading out for basic needs and health essentials during the implementation of the ECQ.
Among the top visitor profiles at the C5 Salonga LED board site are commuters, food lovers, grocery shoppers, gadget enthusiasts, and techies.
Gadget enthusiasts and techie profiles have increased probably because more people are now buying gadgets to use at home.
Data Overview for the C5 Salonga LED board: April 19 to 25

The graph above shows the daily overview of the potential views, reach, and frequency of visits recorded at the C5 Salonga LED board site from April 19 to 25.
The total number of visitors had a 50% increase during this week. The majority of visitors are most likely heading out for important needs only such as for food and health essentials as well as gadgets to use at home.
MAY 2021
Weekly Data Summary for the EDSA Guadalupe LED board: May2021

The table above shows the total number of visitors that the EDSA Guadalupe LED board had received for every week of May 2021 (until May 16 only).
From April 26 to May 2, a total of 1,694,332 visitors were recorded to have passed by the EDSA Guadalupe LED board site. The number of visitors slightly decreased by less than 1% from May 3 to 9 with 1,693,889 visitors.
The number of visitors on EDSA Guadalupe LED further decreased by 21% from May 10 to 16 with 1,333,167 visitors.
Data Overview for the EDSA Guadalupe LED board: May 3 to 9

The graph above shows the daily overview of the potential views, reach, and frequency of visits recorded at the EDSA Guadalupe LED board site from May 3 to 9.
Unique visitors comprise 23% of the total number of visitors who passed by the EDSA Guadalupe LED. This was recorded during the ongoing Modified Enhanced Community Quarantine (MECQ) until May 14.
Despite the decrease in the total number of visitors, the number of unique and new visitors has increased compared to last week’s numbers.
Most people have already adjusted and were now used to the restrictions imposed by the MECQ during this time.
Data Overview for the EDSA Guadalupe LED board: May 10 to 16

The graph above shows the daily overview of the potential views, reach, and frequency of visits recorded at the EDSA Guadalupe LED board site from May 10 to 16.
The total number of visitors decreased by 21% compared to the previous week. Unique visitors comprise 30% of the total number of visitors — the highest number of unique visitors in EDSA Guadalupe LED so far.
Because of the MECQ which ran until May 14, less people are going out on a daily basis.
Weekly Data Summary for the C5 Salonga LED board: May 2021

The table above shows the total number of visitors that the C5 Salonga LED board had received for every week of May 2021 (until May 16 only).
From April 26 to May 2, a total of 1,105,501 visitors were recorded to have passed by the C5 Salonga LED board site. The number of visitors increased by 2% from May 3 to 9 with 1,132,305 visitors.
The number of visitors on C5 Salonga LED decreased by 17% from May 10 to 16 with 941,621 visitors.
Data Overview for the C5 Salonga LED board: May 3 to 9

The graph above shows the daily overview of the potential views, reach, and frequency of visits recorded at the C5 Salonga LED board site from May 3 to 9.
Unique visitors comprise 25% of the total number of visitors who passed by the C5 Salonga LED. This was recorded during the ongoing Modified Enhanced Community Quarantine (MECQ) until May 14.
Despite the decrease in the total number of visitors, the number of unique and new visitors has increased compared to last week’s numbers.
Most people have already adjusted and were now used to the restrictions imposed by the MECQ during this time.
Data Overview for the C5 Salonga LED board: May 10 to 16

The graph above shows the daily overview of the potential views, reach, and frequency of visits recorded at the C5 Salonga LED board site from May 10 to 16.
The total number of visitors decreased by 17% compared to the previous week. Unique visitors comprise 36% of the total number of visitors — the highest number of unique visitors in C5 Salonga LED so far.
Because of the MECQ which ran until May 14, less people are going out on a daily basis.
JUNE 2021
Weekly Data Summary for the EDSA Guadalupe LED board: June 2021

The table above shows the total number of visitors that the EDSA Guadalupe LED board had received for every week of June 2021.
From May 31 to June 6, a total of 1,564,995 visitors were recorded to have passed by the EDSA Guadalupe LED board site. The number of visitors increased by 9% from June 7 to 13 with 1,715,167 visitors and another 5% from June 14 to 20 with 1,801,309 visitors.
The number of visitors on EDSA Guadalupe LED decreased by 7% from June 21 to 27 with 1,666,755 visitors and another 17% from June 28 to July 4 with 1,389,770 visitors.
Data Overview for the EDSA Guadalupe LED board: June 21 to 27

The graph above shows the daily overview of the potential views, reach, and frequency of visits recorded at the EDSA Guadalupe LED board site from June 21 to 27.
The total number of visitors decreased by 7% compared to the previous week. Unique visitors comprise 31% of the total number of visitors.
Travelers are not on the top profiles during this time. Most of the regular visitors are going out for essential purposes only.
Data Overview for the EDSA Guadalupe LED board: June 28 to July 4

The graph above shows the daily overview of the potential views, reach, and frequency of visits recorded at the EDSA Guadalupe LED board site from June 28 to July 4.
The total number of visitors decreased by 17% compared to the previous week. Unique visitors comprise 32% of the total number of visitors — the highest number of unique visitors in EDSA Guadalupe LED in Q2 2021.
Rainy days were also starting to get more frequent during this week which could affect the statistics in the following weeks.
Weekly Data Summary for the C5 Salonga LED board: June 2021

The table above shows the total number of visitors that the C5 Salonga LED board had received for every week of June 2021.
From May 30 to June 6, a total of 1,341,210 visitors were recorded to have passed by the C5 Salonga LED board site. The number of visitors decreased by 2% from June 7 to 13 with 1,316,973 visitors but increased by 8% from June 14 to 20 with 1,424,857 visitors.
The number of visitors on C5 Salonga LED further increased by 21% from June 21 to 27 with 1,813,247 visitors but decreased by 28% from June 28 to July 4 with 1,020,196 visitors.
Data Overview for the C5 Salonga LED board: June 21 to 27

The graph above shows the daily overview of the potential views, reach, and frequency of visits recorded at the C5 Salonga LED board site from June 21 to 27.
The total number of visitors increased by 21% compared to the previous week. Unique visitors comprise 32% of the total number of visitors.
There are more potential visitors in C5 Salonga LED during this week compared to EDSA Guadalupe LED. Most of the regular visitors are going out for essential purposes only.
Data Overview for the C5 Salonga LED board: June 28 to July 4

The graph above shows the daily overview of the potential views, reach, and frequency of visits recorded at the C5 Salonga LED board site from June 28 to July 4.
The total number of visitors decreased by 28% compared to the previous week. Unique visitors comprise 36% of the total number of visitors — the highest number of unique visitors in C5 Salonga LED in Q2 2021.
Rainy days were also starting to get more frequent during this week which could affect the statistics in the following weeks.
Number of Audience Summary from January 2021 to May 2021

For the whole of Q2 2021, the EDSA Guadalupe LED board had received an average of 6,033,775 visits while the C5 Salonga LED board had received an average of 4,473,491 visits.
Top visitor profiles on both EDSA and C5 remain to be commuters, food lovers, grocery shoppers, and gadget enthusiasts.
Other Outcomm billboard sites near the vicinity of the LED board sites such as the EDSA Cristobal MRT billboard on EDSA and C5 Bagong Ilog on C5 have similar statistics.
—
All these data are being detected through Bluetooth, mobile data or WiFi, GPS, and downloaded applications like Google Maps, Waze, Facebook, Twitter, and Skype, all of which can be found on a smartphone.
Learn more about audience measurement! Call us now at 09175375110 or at (02) 8856-2285 and start tracking your digital out-of-home advertising campaigns with Outcomm’s LED video boards.